Every campaign is tied to the pipeline and revenue it brings, in one monthly report
Each month the AI follows every lead from its campaign to the deal it became in Salesforce, and drafts a report of spend, pipeline and revenue by campaign.
- Used day to day by
- Marketing head
- Sales head
- Marketing team
How it runs with AI
The AI pulls the spend and leads for every campaign, follows each lead in Salesforce to its opportunity and any won deal, and adds it up in Power BI. Each report covers the last 3 months, so slower deals have time to show. The marketing head gets a draft that shows which campaigns bring revenue, with a suggested budget change to discuss with sales.
How it is done today
Marketing reports clicks and leads from the ad accounts. Sales reports pipeline from Salesforce. Each month someone spends days downloading both, matching leads to campaigns in Excel and settling the differences with sales, and budgets still follow the cost per lead.
Step by step
Where the work happens, what the AI does, and where it hands over to a person.
-
Step 1, AI
Pulls 3 months of spend and leads for every campaign
Needs to know: Campaigns in scope, Reporting window
In
 Google Ads ,
  LinkedIn Ads ,
  Google Analytics ,
  Salesforce
 -
Step 2, AI
Follows each lead in Salesforce to the deal it became
Needs to know: Campaign tags on leads, Agreed credit rule
In
Salesforce Exception to step 2
Sends leads with no campaign source to marketing to tag
-
Step 3, AI
Adds up pipeline and revenue for each campaign
Needs to know: What counts as pipeline
In
 Power BI
 -
Step 4, AI
Drafts the monthly summary with what to change
Needs to know: Budget by campaign, Past monthly reports
In
Power BI -
Step 5, Person
Reviews it and sets next month's budget with the sales head
In
Power BI
What stays with a person
- Reviews it and sets next month's budget with the sales head
Why each report covers 3 months
Most deals take weeks to go from a first enquiry to an opportunity, and months to close. A report on one month’s leads would show little pipeline yet. Each monthly report looks at the last 3 months of campaigns, so the numbers have time to show. A trade show’s open deals count as pipeline until they close.
Apps in this example
- Google Analytics
- Google Ads
- LinkedIn Ads
- Salesforce
- Power BI
The same flow works with the apps you use.
This fits you if
- You run several campaigns at a time across search, LinkedIn and events
- Your leads go into Salesforce from website forms and event lists
- Your deals take weeks or months from first enquiry to order
- Budgets today follow cost per lead or clicks
What to watch for
- Each lead needs its campaign recorded. Website forms keep the campaign tags (UTM) from the ad link, and event lists are uploaded with their campaign set
- Credit goes to the campaign that first brought the contact in. Your team agrees this rule with sales up front, and can share credit across every campaign a contact touched
- Budget changes stay with the marketing head and the sales head. The report suggests, and they decide
Often done together
Marketing Campaigns and ads
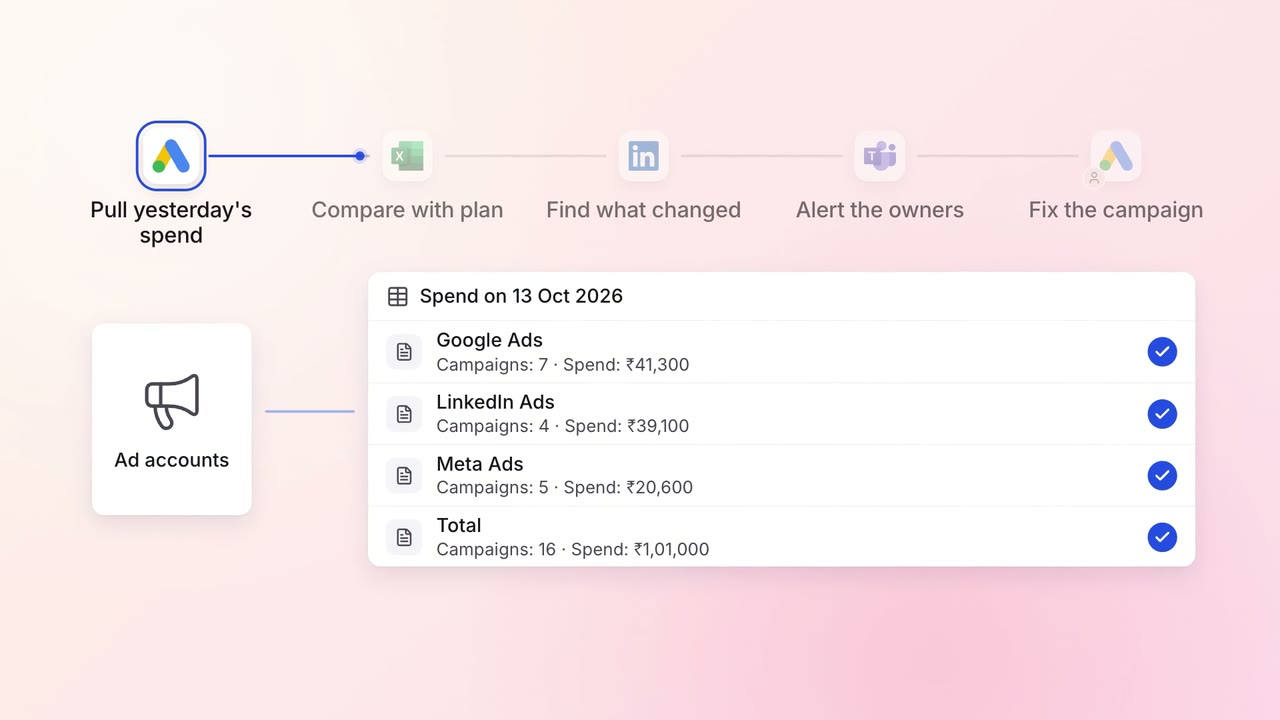
Ad spend on Google, LinkedIn and Meta is checked against the plan every morning
- Google Ads
- LinkedIn Ads
 Meta Ads
 Excel
Excel Microsoft Teams
Sales Pipeline and forecasting
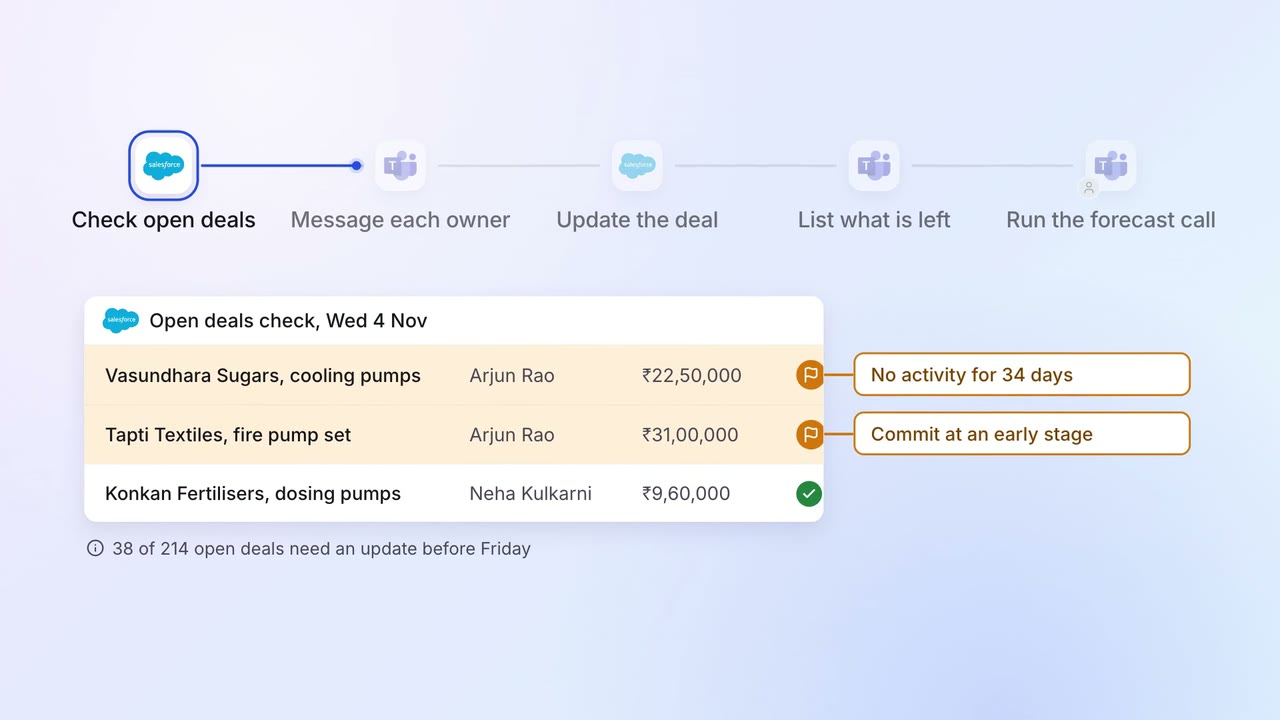
Every open deal is checked before the forecast call, and stale ones go back to their owners
- Salesforce
- Microsoft Teams
Sales Pipeline and forecasting
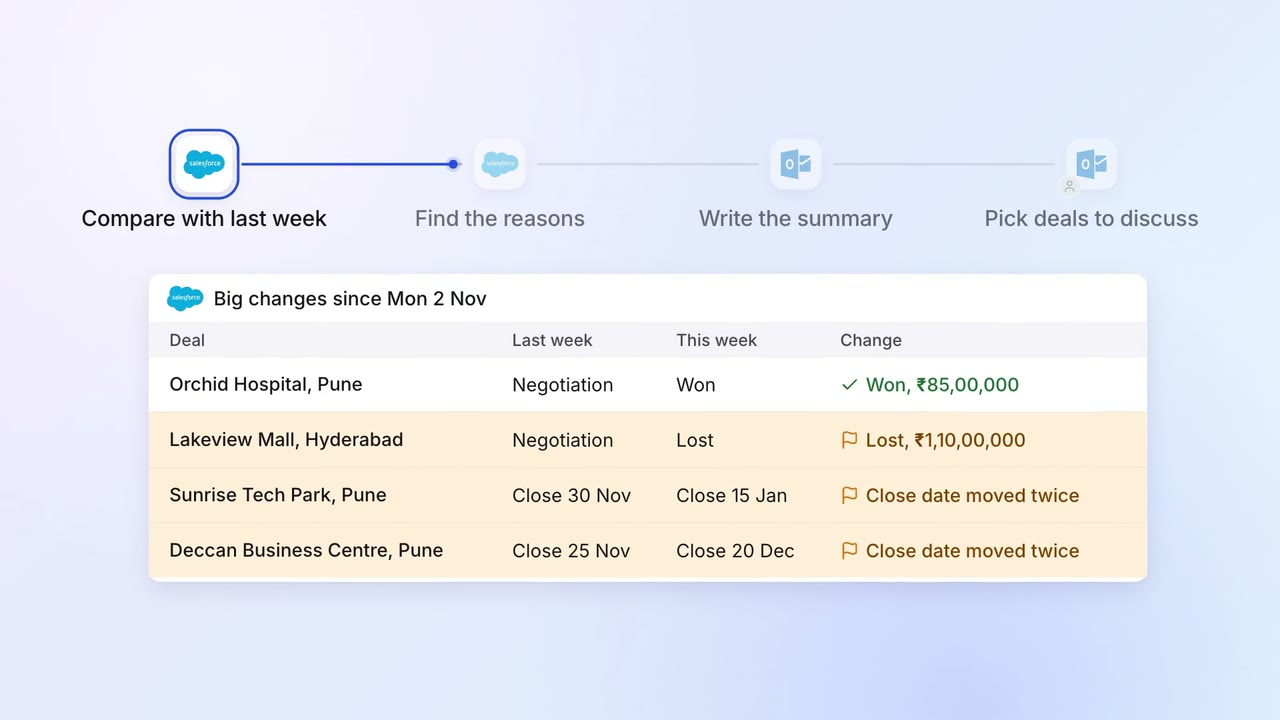
The sales head gets a one-page pipeline summary every Monday, with what changed and why
- Salesforce
 Outlook