The weekly marketing report arrives with what changed and why
Every Tuesday the AI pulls last week's numbers, picks out what moved, finds the likely cause of each move and drafts the note in Power BI. Your marketing head checks it and sends it.
- Used day to day by
- Marketing head
- Marketing team
- Regional sales managers
How it runs with AI
Every Tuesday morning, the AI pulls last week's numbers, compares each one with the last 4 weeks and picks out the moves outside the usual range. For each move it looks for the cause in the page data, the marketing calendar and the website change log, and drafts a short note in Power BI. Your marketing head checks it and sends it out the same morning.
How it is done today
Every Monday, someone in marketing exports last week's numbers from Google Analytics, refreshes the Power BI report and writes a few lines of comment. The comment says what moved, and seldom why. Finding the cause means asking the web, campaign and regional teams, so the report reaches sales mid-week.
Step by step
Where the work happens, what the AI does, and where it hands over to a person.
-
Step 1, AI
Pulls last week's visits and enquiries by channel, page and region
Needs to know: Measures the report tracks
In
 Google Analytics
 -
Step 2, AI
Compares each number with the last 4 weeks and picks out the big moves
Needs to know: Usual range per measure
In
 Power BI
 -
Step 3, AI
Finds the likely cause of each move in the page data, the marketing calendar and the change log
Needs to know: Marketing calendar, Website change log, Same week last year
In
Google Analytics ,  SharePoint ,
  Microsoft Teams
 Exception to step 3
Alerts the web team on Teams straight away when a form or page has stopped working
-
Step 4, AI
Drafts the report in Power BI with a short note on what changed and why
Needs to know: House note format
In
Power BI -
Step 5, Person
Checks the note, edits it if needed and sends the report to sales and leadership
In
Power BI
What stays with a person
- Checks the note, edits it if needed and sends the report to sales and leadership
Where it looks for the cause
- Page data in Google Analytics: which pages, cities and channels moved, and whether visitors opened a form and sent it
- The marketing calendar: campaigns, emails, webinars, events and dealer meets, with their dates
- The website change log: every release and page change, with its date and time
- The same week last year: for festivals and other seasonal swings
Each cause in the note comes with the evidence beside it, so your marketing head can check it in a minute.
Apps in this example
- Google Analytics
- Power BI
- SharePoint
- Microsoft Teams
The same flow works with the apps you use.
This fits you if
- You send a weekly marketing report to sales or leadership
- Your website brings in enquiries for several product lines or regions
- Your team keeps a marketing calendar and a log of website changes, even in Excel
- Today's comment says what moved more often than why
What to watch for
- Google Analytics can take 24 to 48 hours to finish processing a day's data, so the report runs on Tuesday morning, once last week's numbers have settled
- The AI finds causes in what your team records. A campaign or site change missing from the calendar or change log shows up as "cause unknown", for a person to look into
- A weekly report finds a broken form up to a week after it breaks. Where every enquiry counts, add a daily check on your enquiry forms
- Your marketing head reads every note before it goes out and decides what to do about each move
Often done together
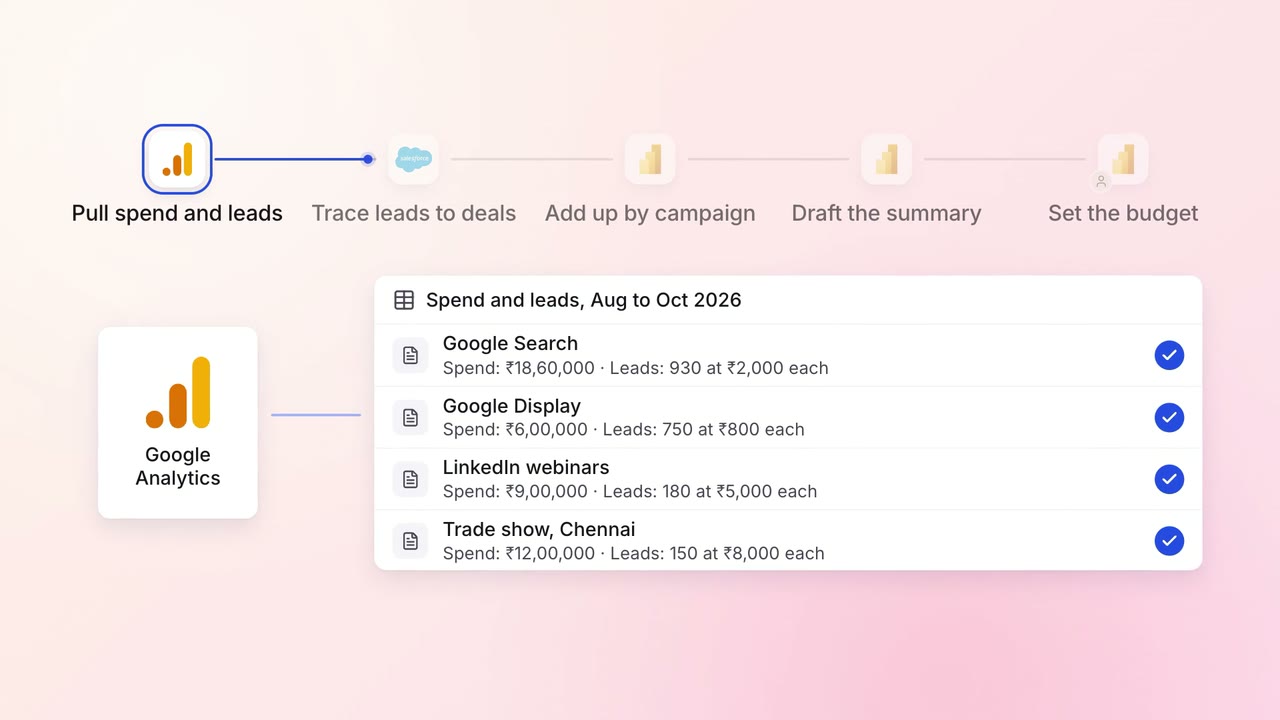
Marketing Reporting
Every campaign is tied to the pipeline and revenue it brings, in one monthly report
- Google Analytics
 Google Ads
 LinkedIn Ads
 Salesforce
- Power BI
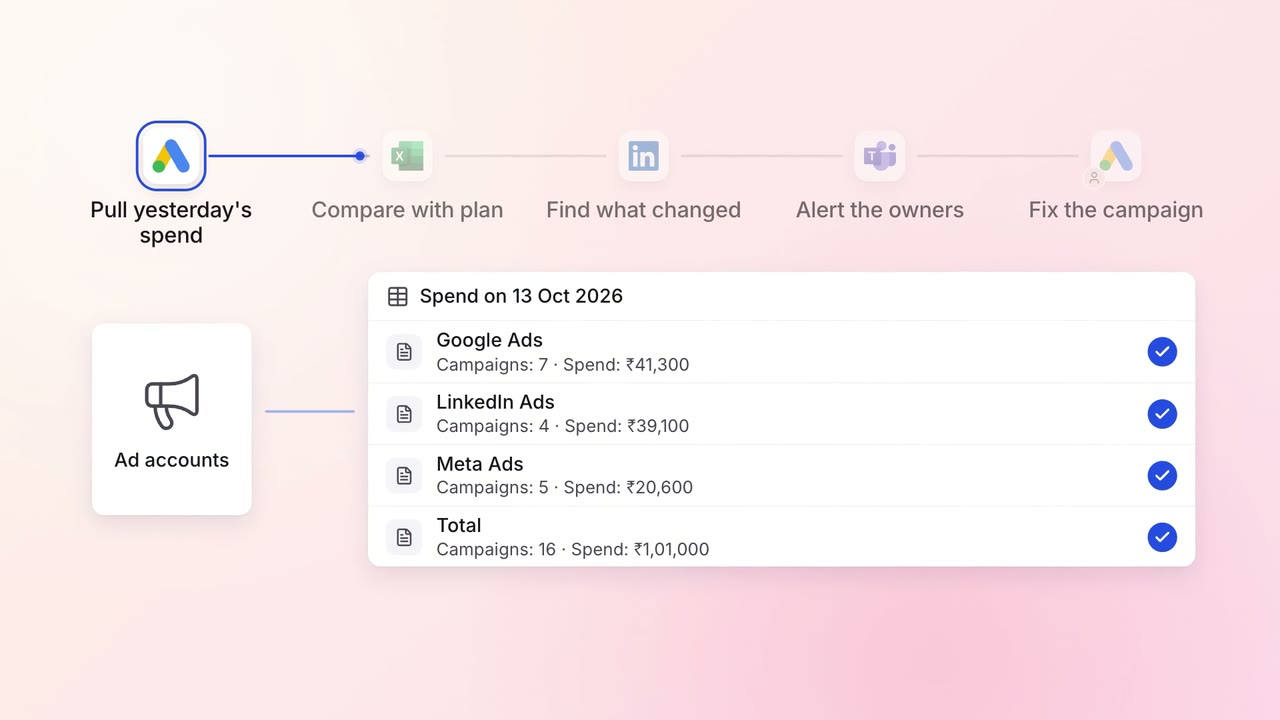
Marketing Campaigns and ads
Ad spend on Google, LinkedIn and Meta is checked against the plan every morning
- Google Ads
- LinkedIn Ads
 Meta Ads
 Excel
Excel- Microsoft Teams
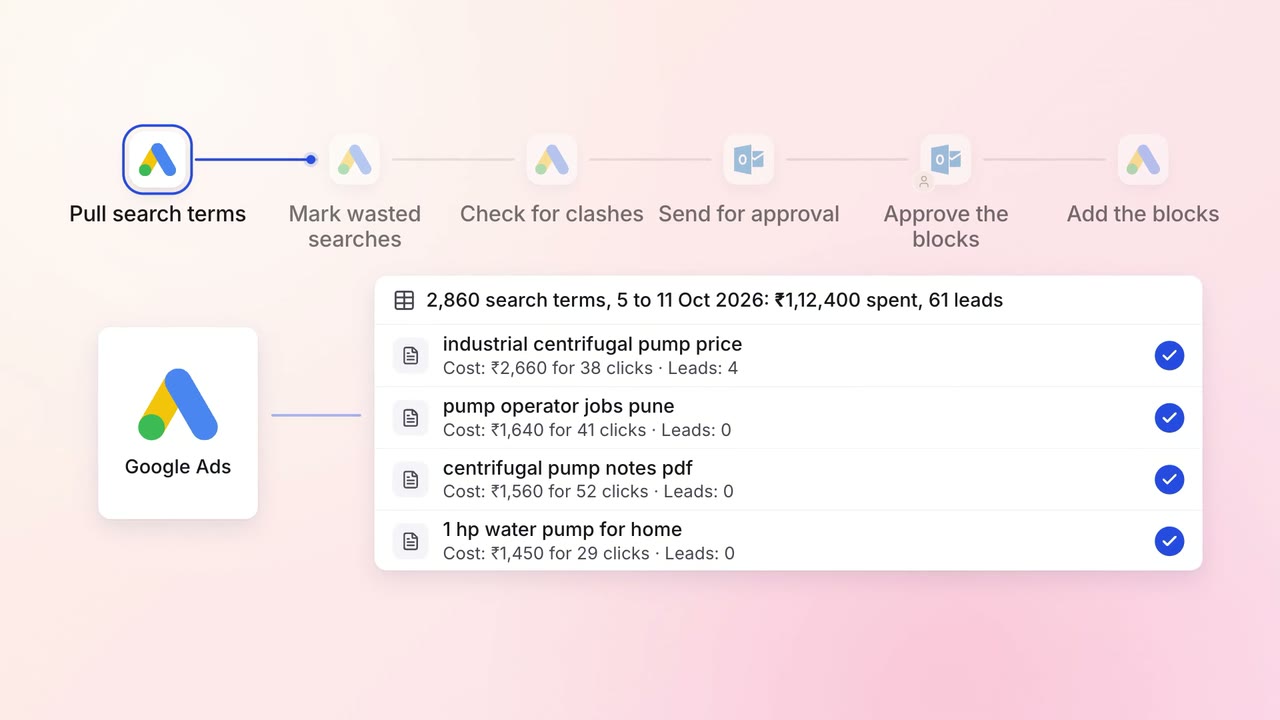
Marketing Campaigns and ads
Searches that waste your Google Ads budget are found and blocked every week
- Google Ads
 Outlook